LCS health metrics will be deprecated soon and is time to start our own Application Insights on Azure to store the monitoring and telemetry generated by our DEV/Sandbox and Production environments.
Starting on version 10.0.30 PU54 a new feature be included to capture this telemetry and store it in Azure AppInsights; like previously were did for Dynamics Commerce with the feature of “Operational Insights” [System administration -> Setup -> Monitoring and telemetry parameters]


Initially Interactive and Batch exceptions be captured, we have properties tagged for legal entity and BatchJobId where required and the userid. Using this telemetry, you be able to construct some Azure Data Explorer Dashboards to review this telemetry like the following:
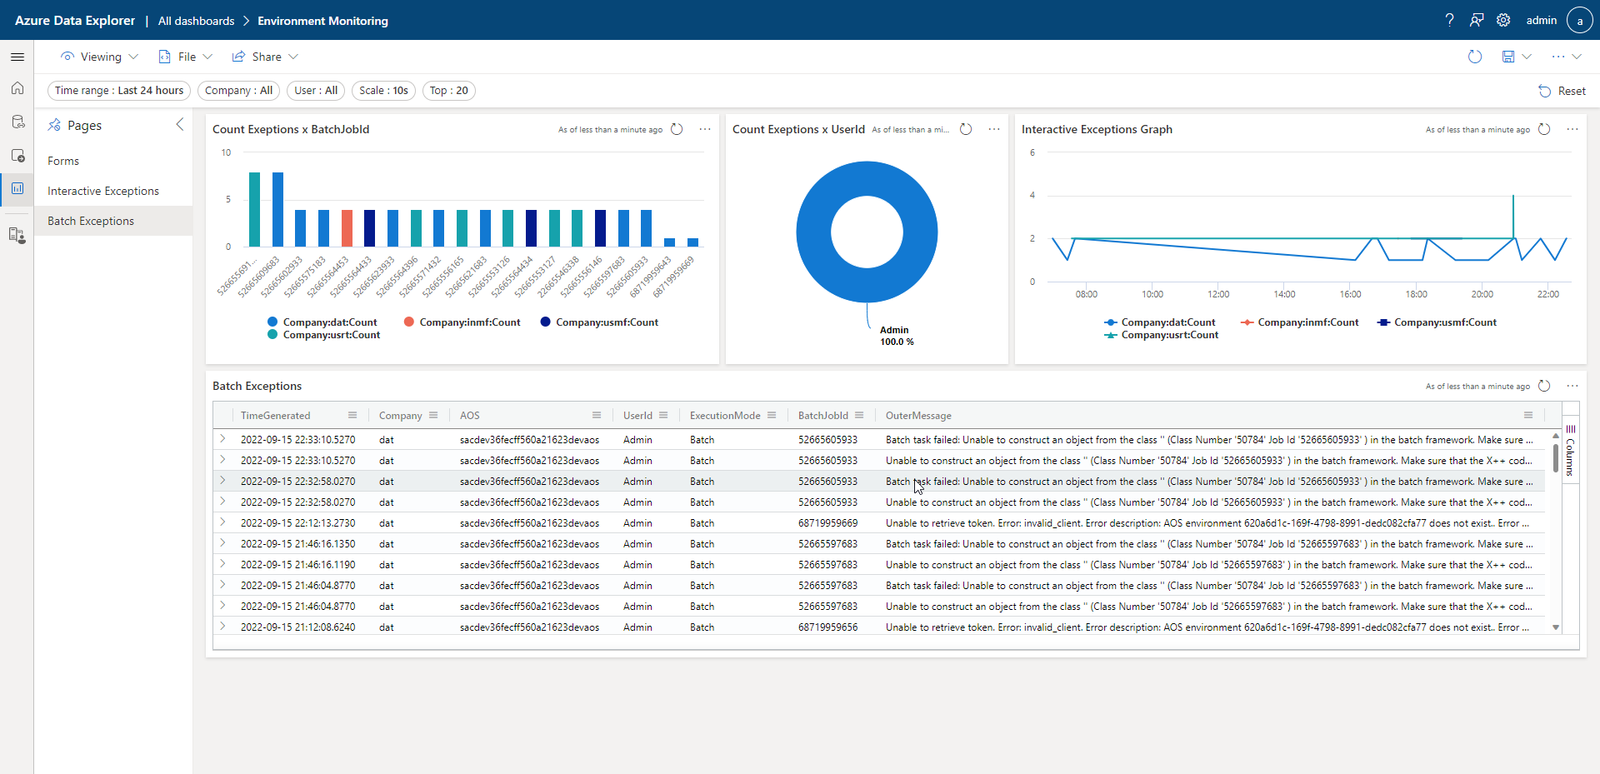
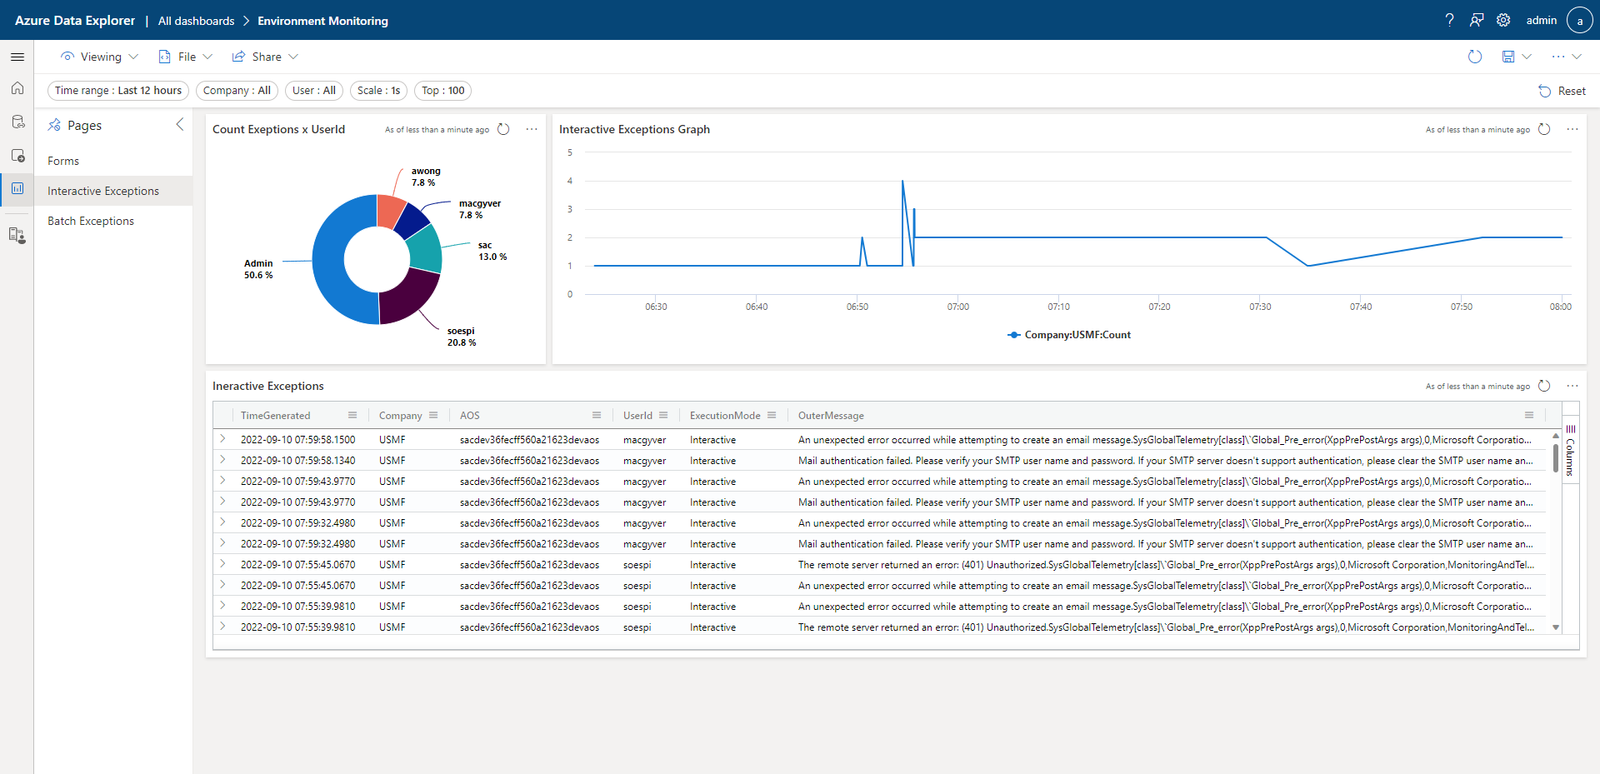
List of actions to enable the feature and collect the telemetry:
- Create one Application Insight
- Enable the Feature “Monitoring and Telemetry”
- Create your own dashboards
Creating the Application Insights
- Create your own Application insights in your Azure subscription: Create a new Azure Application Insights resource – Azure Monitor | Microsoft Learn
- Copy the Instrumentation Key
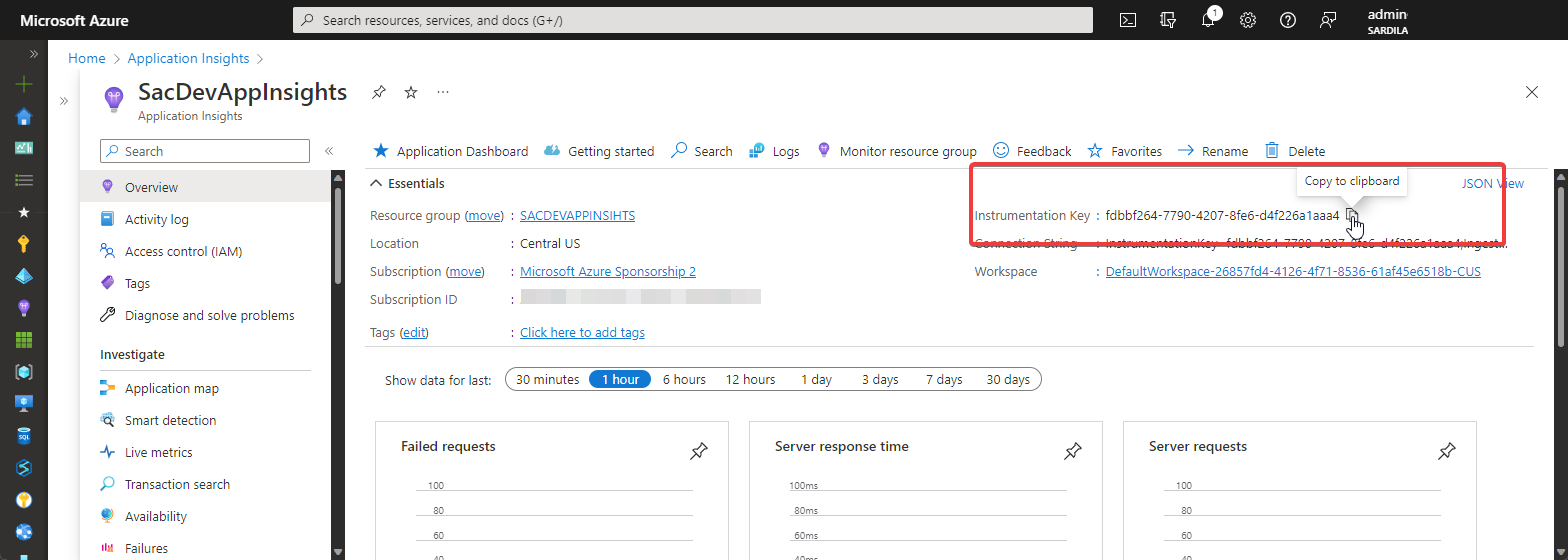
Configuring the feature:
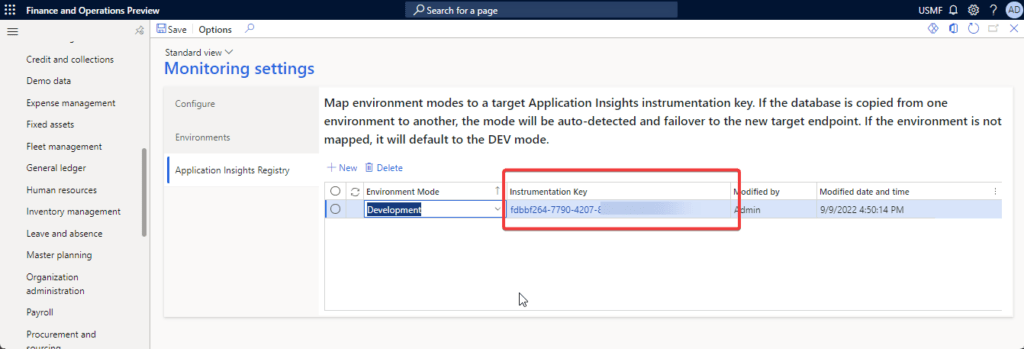
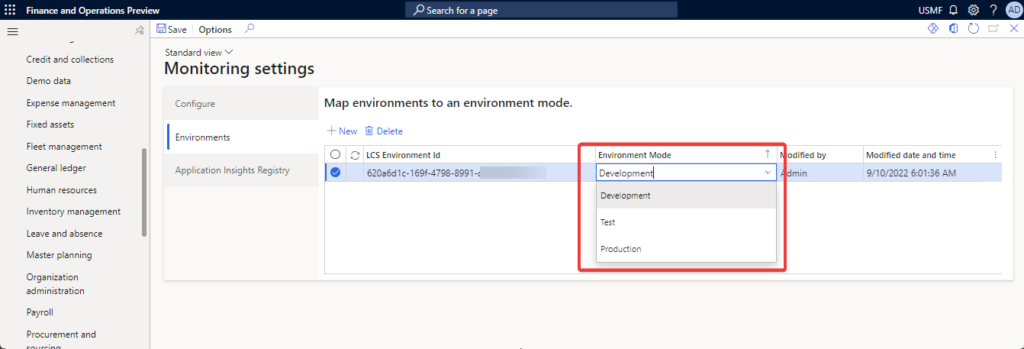
To configure the feature of Monitoring and telemetry, you should use the EnvironmentId that you can locate in everyone environment (Dev/Sandbox/Production) in LCS and the instrumentation key previously copied.
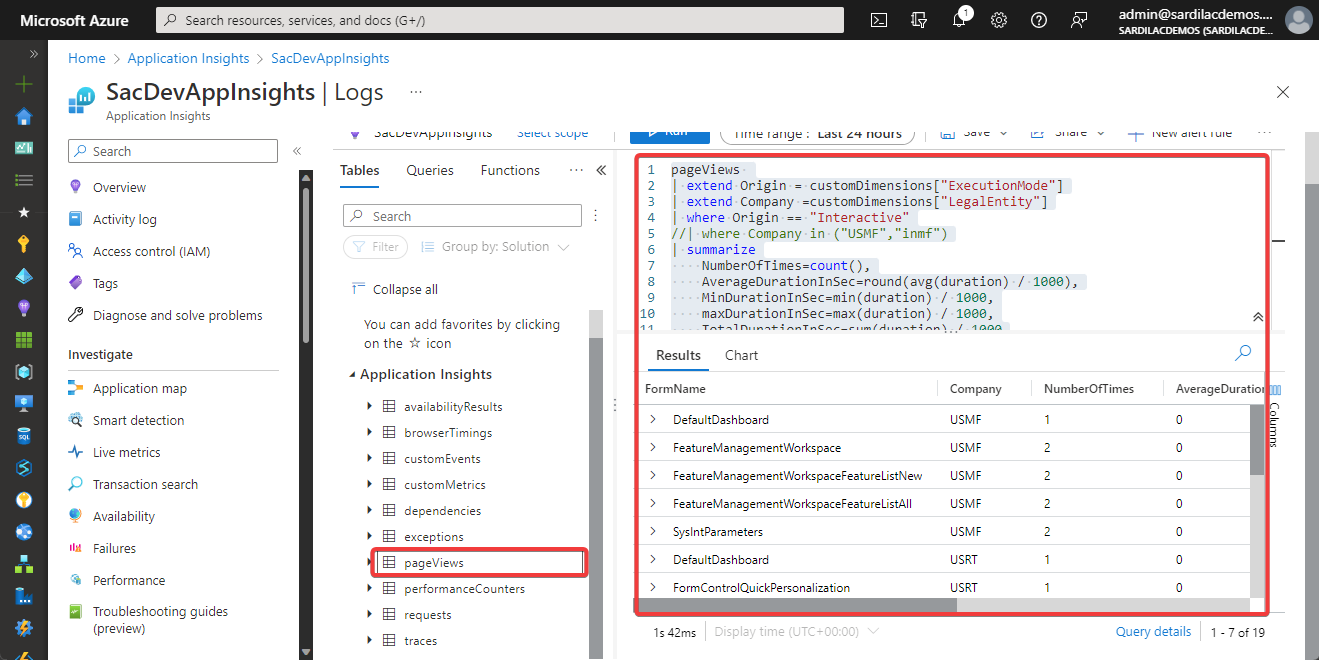
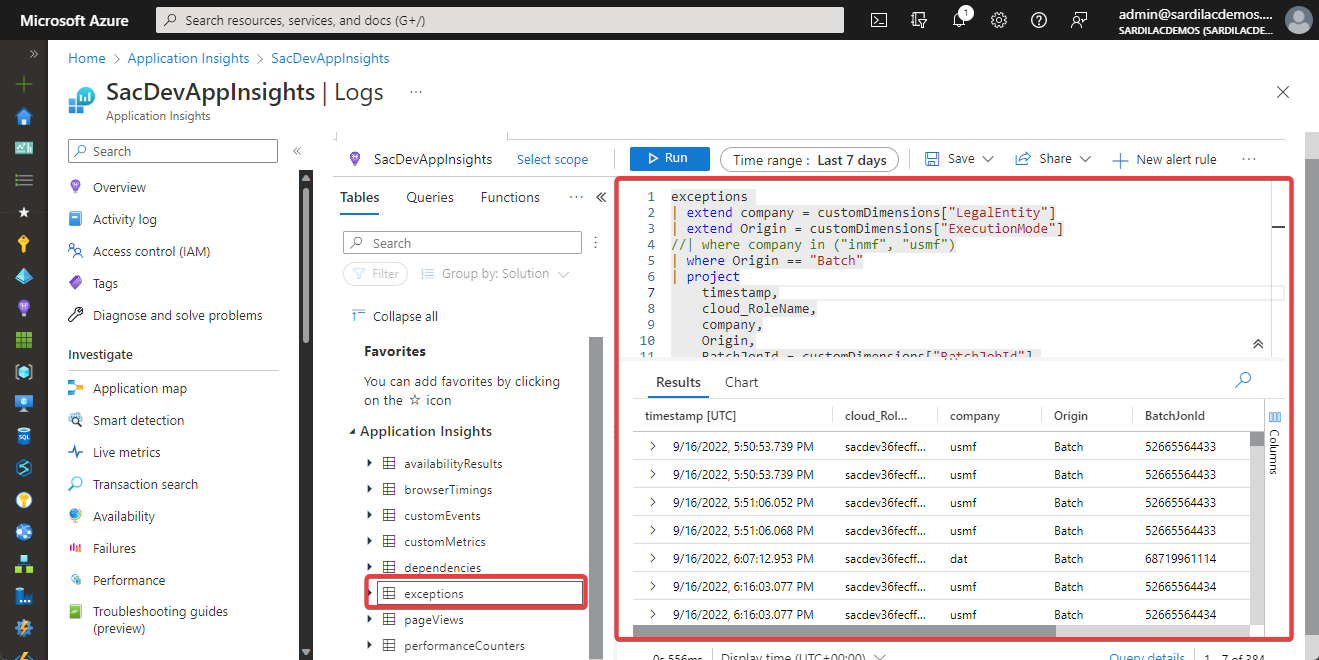
After configuring this, our environment is already generating telemetry that we can review directly in our Application Insight in Azure using Kusto queries like the following at the moment in only two tables (exceptions and pageViews)
- pageViews: Form load times
- exceptions: All the exceptions that are generated in the system, whether they are from interactive or batch sessions
You will be able to make filters based on the customDimensions, which have an indicator of whether the exception occurred in the interactive AOS or in the Batch AOS
Forms Telemetry
pageViews
| extend Origin = customDimensions["ExecutionMode"]
| extend Company =customDimensions["LegalEntity"]
| where Origin == "Interactive"
//| where Company in ("USMF","inmf")
| summarize
    NumberOfTimes=count(),
    AverageDurationInSec=round(avg(duration) / 1000),
    MinDurationInSec=min(duration) / 1000,
    maxDurationInSec=max(duration) / 1000,
    TotalDurationInSec=sum(duration) / 1000
    by FormName=name, tostring(Company)
Exceptions for Batch
exceptions
| extend company = customDimensions["LegalEntity"]
| extend Origin = customDimensions["ExecutionMode"]
//| where company in ("inmf", "usmf")
| where Origin == "Batch"
| project
    timestamp,
    cloud_RoleName,
    company,
    Origin,
    BatchJonId = customDimensions["BatchJobId"],
    outerMessage
Using Azure Data Explorer
Azure Data Explorer is a fully managed, high-performance, big data analytics platform that makes it easy to analyze high volumes of data in near real time. The Azure Data Explorer toolbox gives you an end-to-end solution for data ingestion, query, visualization, and management.
User-friendly query language
Query Azure Data Explorer with the Kusto Query Language (KQL), an open-source language initially invented by the team. The language is simple to understand and learn, and highly productive. You can use simple operators and advanced analytics.
Since we have configured our application insights, we can use the workspace to use it as a data source for Azure Data Explorer.
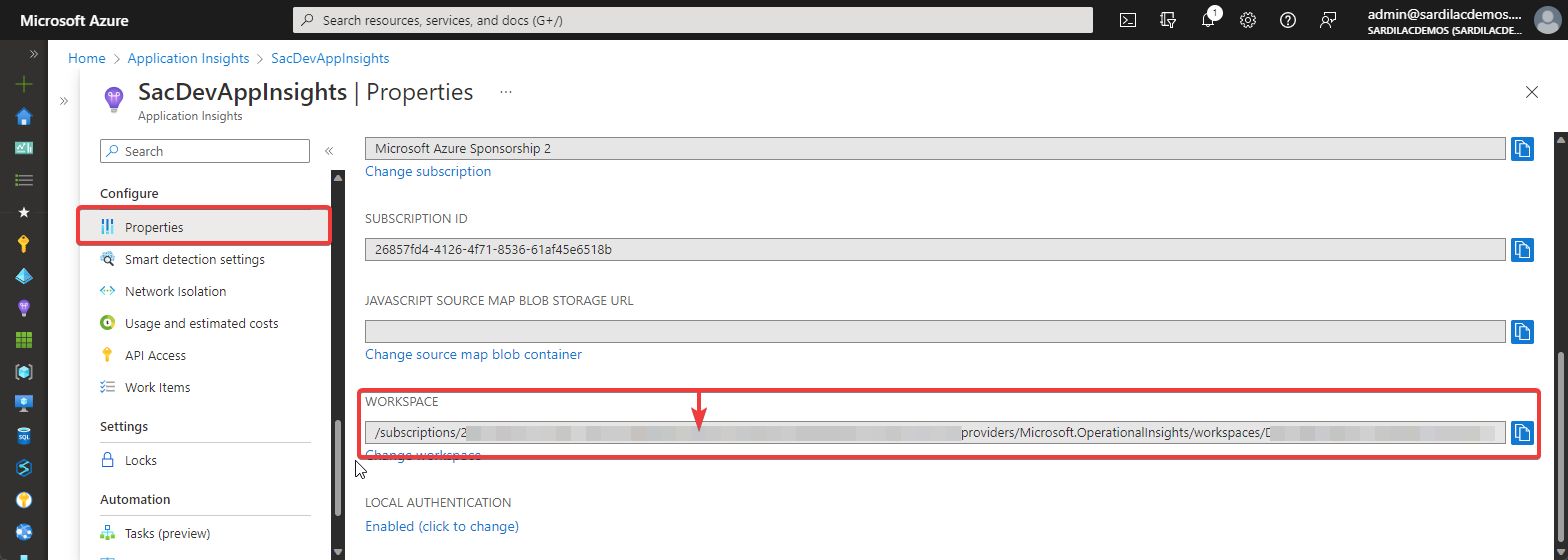
The first thing we must do is enter Azure data explorer and configure a new cluster to test the Kusto queries to retrieve the telemetry data. to do that is necessary to know the Application Insight workspace path, that you can locate in the Application Insight properties:
Add a Log Analytics/Application Insights workspace to Azure Data Explorer client tools
Add a Log Analytics or Application Insights workspace to Azure Data Explorer client tools to enable cross-service queries for your clusters.
- Verify your Azure Data Explorer native cluster (such as help cluster) appears on the left menu before you connect to your Log Analytics or Application Insights cluster.

- In the Azure Data Explorer UI (https://dataexplorer.azure.com/clusters), select Add Cluster.
- In the Add Cluster window, add the URL of the LA or AI cluster.
- For AI:
https://ade.applicationinsights.io/subscriptions/<subscription-id>/resourcegroups/<resource-group-name>/providers/microsoft.insights/components/<ai-app-name>.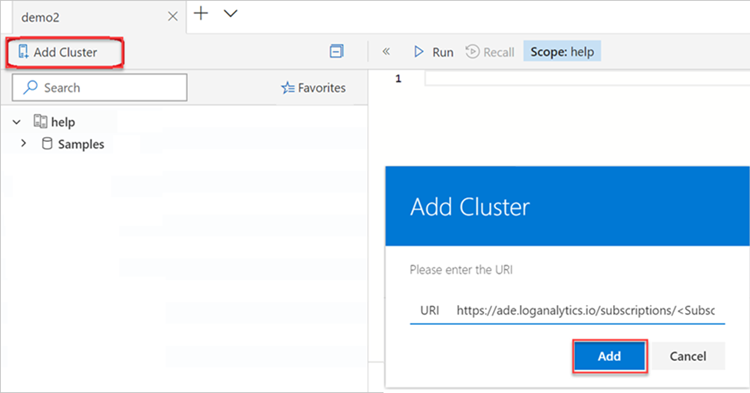
- For AI:
- Select Add
Now you are ready to generate your own queries and your own dashboards with the telemetry information of your environments; Note that the list of tables in the clusters will now be longer since you can use all the telemetry stored in Application Insights that comes from other Azure objects.
To query the telemetry generated from the forms and exceptions generated in the interactive and Batch AOS, you must use the following tables:
- AppPageViews
- AppExceptions
This would be an example of Kusto query in Azure data explorer:
let ['_company']=dynamic(null);
let ['_startTime']=datetime('2022-09-10T06:20:39Z');
let ['_endTime']=datetime('2022-09-11T06:20:39Z');
let ['_scale']='10s';
let ['_userId']=dynamic(null);
AppExceptions
| where TimeGenerated between (_startTime .. _endTime)
| extend Company = Properties["LegalEntity"]
| extend ExecutionMode = Properties["ExecutionMode"]
| where isempty(_company) or Company in (_company)
| where isempty(_userId) or UserId  in (_userId)
| where ExecutionMode == "Interactive"
| summarize Count = count() by bin (TimeGenerated, totimespan(_scale)),
    tostring(ExecutionMode), tostring(Company)
| render timechart
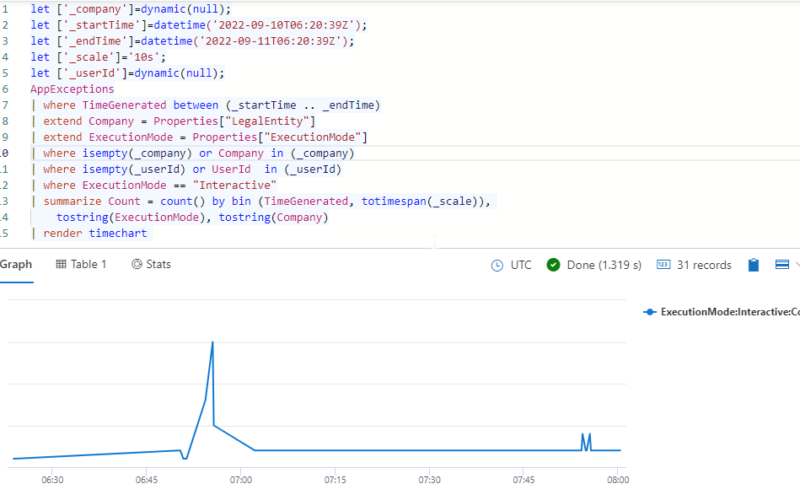
In the following link you can download a json file that contains the export of the dashboard that I used to capture the images used this post. After importing it, make sure to edit the cluster URL in the dashboard parameters so that it points to your Application Insights workspace.
This is the link to the official documentation: Monitoring and telemetry using Application Insights – Finance & Operations | Dynamics 365 | Microsoft Learn
